
White Paper: The High-Growth Market Trap — Navigating the Recovery in Multifamily
Posted
April 21, 2026
Introduction
As we enter 2026, much of the multifamily industry has declared victory over supply, assuming that 18 months of declining starts will soon translate into imminent recovery. The instinct is understandable, but likely premature. At Virtú, we view falling supply as a necessary, but not sufficient, condition for recovery. In high-growth markets, the same fundamentals that drive long-term demand also attract outsized capital, extending the supply overhang well beyond the slowdown in new starts. This lagged imbalance between capital-driven supply and organic demand is the essence of the “high-growth market trap.”
High-growth apartment markets are assumed to offer superior rent growth and attractive risk-adjusted returns, but history suggests otherwise. In several major U.S. markets, rapid demand growth has produced prolonged stagnation rather than sustained appreciation, what we term a "lost decade." For investors who entered at the prior cycle's peak, the math is unforgiving: flat revenues, rising operating costs, and valuations depressed for seven years or more. Buying after a sharp correction offers little protection when the recovery itself takes that long.
This paper is a companion to our recent analysis, “The Asymmetric Opportunity in U.S. Multifamily.” It outlines the three structural drivers that create lost decades, and why timesince-peak-supply and discount-from-peak-pricing are the wrong metrics for identifying the next recovery.

The Growth Paradox
Strong demand attracts capital, and capital attracts overbuilding. When that excess supply meets an economic downturn, rent growth can stay suppressed far longer than traditional cycle models predict. Austin and Denver boomed into 2001, then spent the better part of a decade going nowhere, with cumulative revenue growth from 2001 to 2011 essentially flat. Phoenix, Las Vegas, and Sacramento followed the same arc after 2008, with meaningful recovery not arriving until 2015- 2016. In each case, declining starts signaled opportunity but didn’t deliver it.
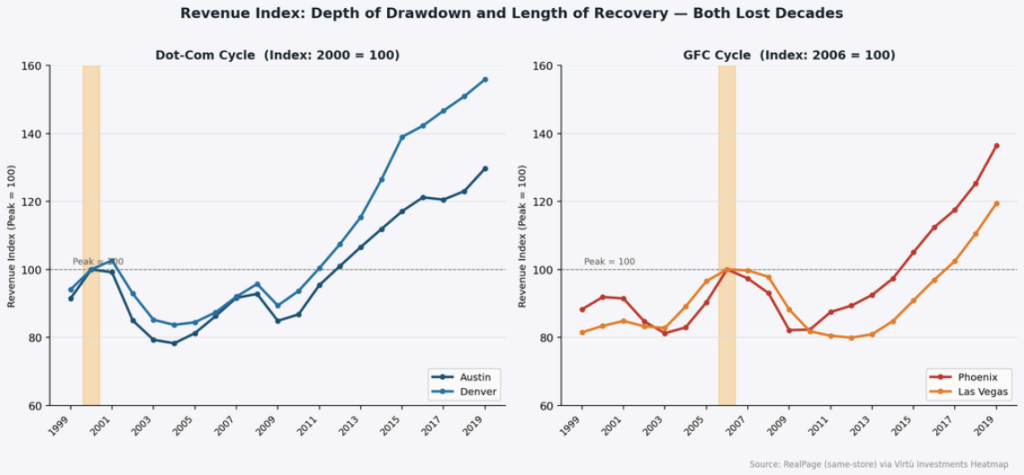
What these markets shared was an excess of conviction at both ends of the cycle. Near the peak, abundant capital fueled overbuilding. Near the trough, that same conviction prevented clearing. Developers, lenders, and investors extended and pretended on existing positions while doubling down on new ones, leaving the market unable to truly reset. Declining starts were real, but they were a false signal.
Today’s Data Divergence: Not All Markets Are the Same
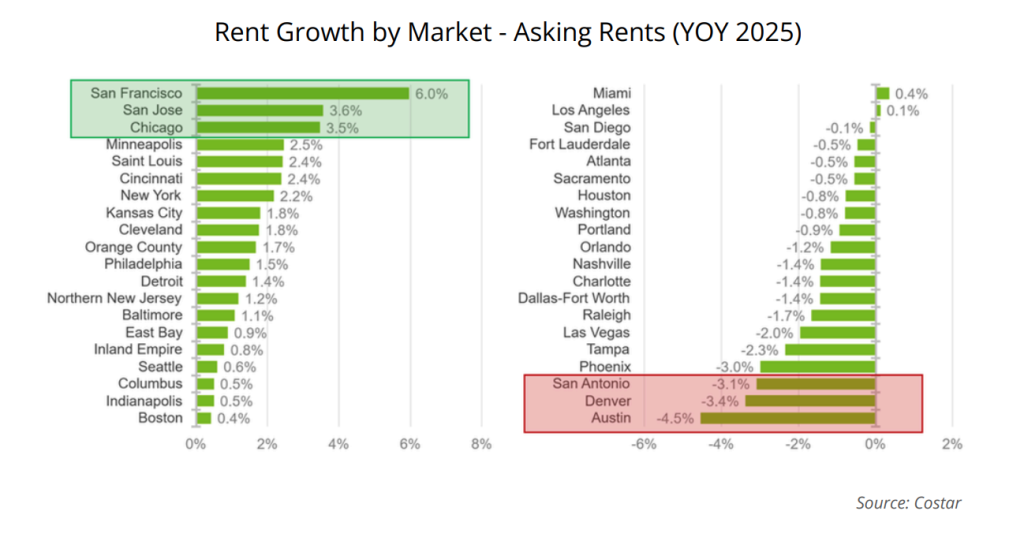
Today, in the west, the high-growth markets of Denver, Austin, and Phoenix, are among the weakest-performing multifamily markets in the nation. These markets show limited signs of near-term trend reversal despite falling additions to apartment stock (RealPage). Conversely, lower-growth, supply-constrained markets driven by income growth continue to lead the national recovery. The Bay Area is the most obvious example, where limited supply and renewed tech-sector demand have pushed San Francisco to approximately 6% year-over-year rent growth, the strongest in the nation (RealPage).
For the past few years, the Sun Belt was viewed as a monolithic entity. Now, as we move past peak supply, we are seeing a split between “early” and “late” recovery markets (CoStar, Jan 2026). We expect this leader/laggard phenomenon to essentially repeat patterns we have seen in prior cycles, and with today’s improved data sets, we can extend our analysis to submarkets in this cycle.
Looking at supply deliveries alone is insufficient. Each market has a unique combination of supply overhang, demand trajectory, and capital structure stress. We use a three-driver framework to provide the lens to distinguish markets approaching recovery from those that will see little-to-no growth in the near future.
The Three Drivers of a “Lost Decade”
A lost decade is a structural failure caused by three converging drivers that prevent a market from resetting
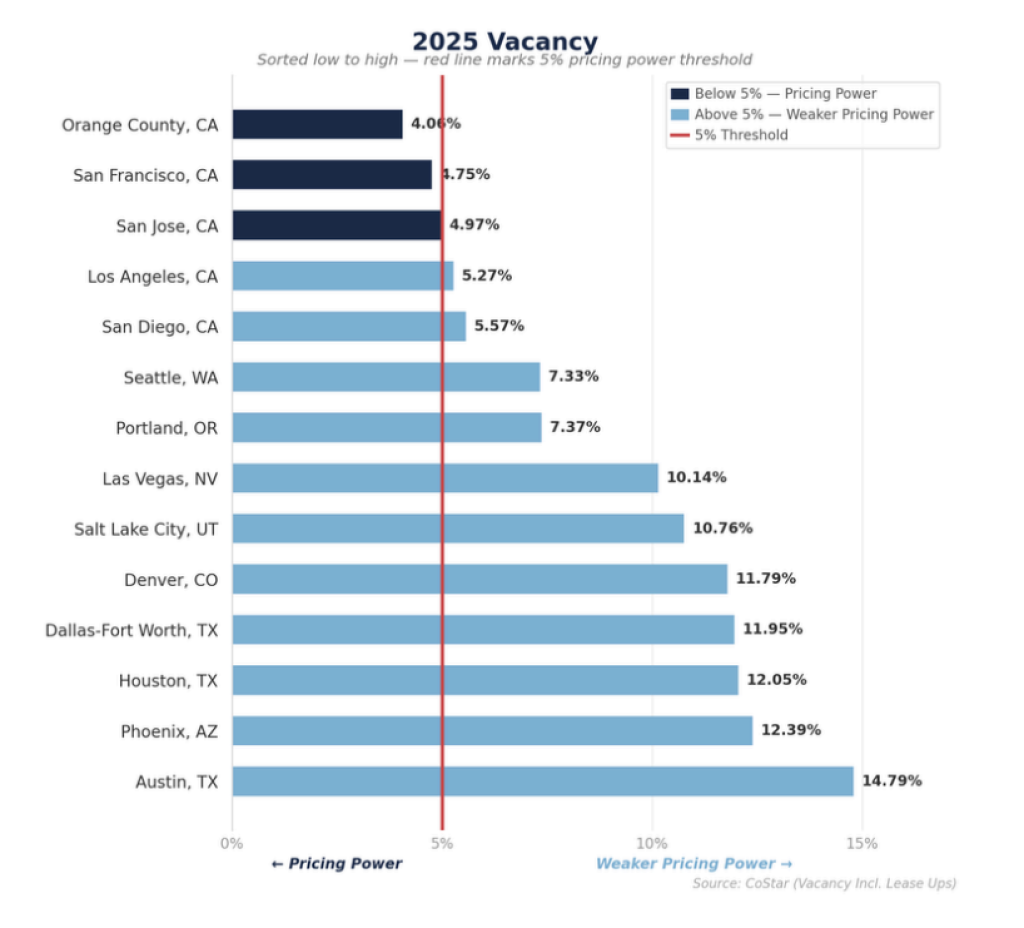
Driver # 1: The “Vacancy Gap”
We define the vacancy gap as the gap between a market’s current vacancy rate, including active lease-ups, and the point at which it achieves 95% occupancy. The gap represents the number of units that must be absorbed before operators regain pricing power.
Driver #2: Demand Fragility
The second driver of a lost decade is a decoupling of demand from boom-era headlines. High-growth industries that powered these markets during expansion are often the first to contract in a downturn, suppressing household formation even as population trends remain positive. The supply overhang that followed peak demand compounds the problem further. As construction rolls off, the loss of construction-related employment softens the local economy, creating a negative feedback loop that erodes multifamily demand from the bottom up. This makes trailing absorption, the figure most commonly cited to justify near-term recovery, an unreliable guide.
The data is beginning to reflect a change in the labor market, with the Bureau of Labor and Statistics (BLS) jobs data trending down in 2025 and multifamily absorption levels following suit. The markets most reliant on job growth, versus income-growth, often suffer the most during these times.
Possible Silver Lining
One demand tailwind has limited historical parallel: the widening gap between renting and homeownership. The full monthly cost of ownership is now approximately 105% higher than average apartment rent, making it effectively twice as expensive to buy as it is to rent (CBRE, 2026). When combined with a shortage of 3.4 million single-family homes and more than $7 trillion in mortgages locked in below 4%, the structural renter base has expanded meaningfully, though not uniformly. The effect is most pronounced in supply-constrained markets like the Bay Area, where it is a substantial contributor to current outperformance.
Driver #3: Stubborn Capital
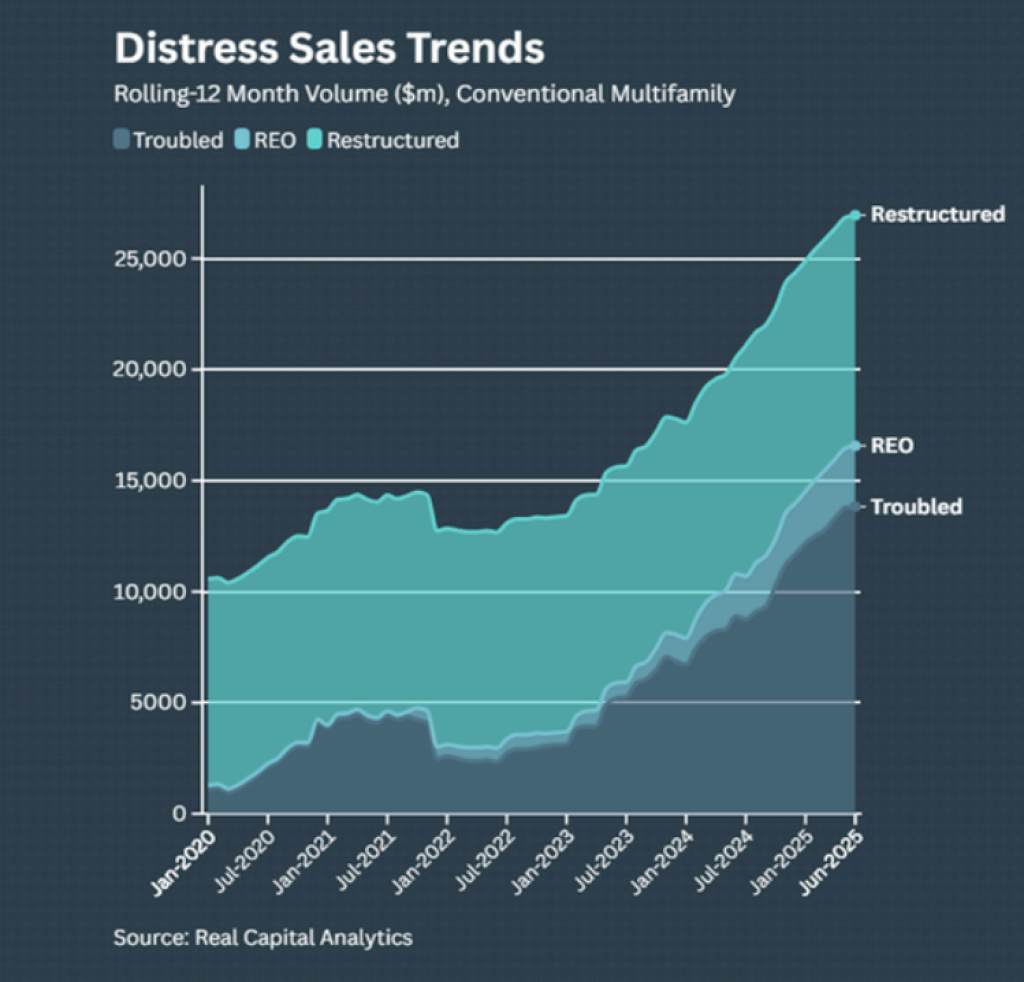
In many high-growth, high-supply markets today, the vacancy gap remains wide, held open by ownership that has not yet capitulated to the reality of market rents. Through 2024 and 2025, lender extensions and capital calls allowed operators to avoid clearing at prices that reflected market rents. This left shadow supply in place long after new deliveries peaked, kept rents artificially elevated, and vacancy unresolved. The drag on recovery is no longer construction volume; it is stalled lease-ups, incomplete renovations, and operators defending pro formas the market stopped supporting two years ago. The recovery is further delayed when new capital re-enters too early. Developers and eager value-add operators who attract capital don’t fully allow the market to heal. When a second wave of capital arrives before the first has fully worked through, the real recovery is pushed out further. That is beginning to change. Distress-related apartment sales nearly doubled in 2025 versus the prior year, the first concrete sign that conviction is giving way to resolution. With approximately $162 billion in multifamily loans maturing in 2026, a 56% increase over 2025, the pressure to resolve rather than extend should accelerate further (MSCI-RCA, 2026).
Outcome: The Value Trap
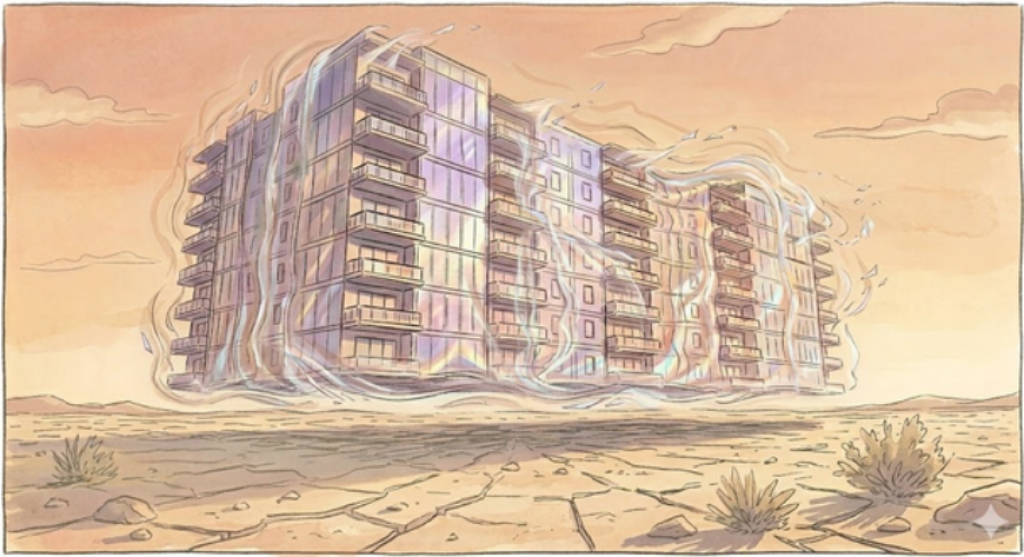
An asset can look like a bargain and still be a bad investment. When properties trade below replacement cost but cannot generate enough demand to improve occupancy or raise rents, they become value traps. Expenses continue to compound while the thesis never clears. For investors accustomed to underwriting mean reversion, the danger is that the entry price anchors the analysis: a 30% discount from peak feels like a margin of safety, but in a market with a deep vacancy gap and no near-term pricing power, it is just a long path to recovery. The discount may be real, but the recovery is a mirage. Capital underwriting a recovery that does not arrive on schedule faces both delayed returns and compounding NOI erosion as insurance, taxes, and operating costs rise against flat or declining revenue. Nominal rent recovery does not equal NOI recovery, and standard underwriting rarely prices in that gap.
The Value Trap: The discount may be real, but the recovery is a mirage
Conclusion
Until more evidence emerges, we remain cautious on the consensus expectation of a broad-based recovery. We believe a high-growth market value trap exists today in many markets.
Weak investments in real estate begin with good narratives applied incorrectly during cycles. The variance between markets is significant. Even in high supply markets there can be inconsistencies between cycles: 2001 Phoenix/Las Vegas performed far better than Austin/Denver, but in 2008 the situation was reversed. The contrast is starker still when lowsupply markets are considered: San Francisco saw 6% rent growth in 2025, while the darling high-growth market of Austin was -4.5% for the same period.
As investors position capital in 2026, the question is not whether the supply wave is receding, which it is, but whether the three structural drivers of a lost decade are being reflected in the markets being underwritten. At Virtú, we have consistently sidestepped these lost decade markets in the past.
More importantly, strong investments are available today, with opportunities emerging in a few select markets and submarkets.
We would revisit our market-by-market caution if several of the following emerged simultaneously:
- Spring 2026 absorption sustaining well above historical averages;
- The 10-year Treasury dropping below 4%, unlocking meaningful transaction volume;
- Job growth rebounding to pre-2025 levels for multiple consecutive months;
- Vacancy holes in high-supply markets filling rapidly with lease-up concessions declining;
- A decisive shift in lender behavior from extension to resolution.
A Note on the Use of AI
Today at Virtú, we are using AI-assisted research and machine learning to drive the underwriting process that identifies these opportunities. Compared to nine months ago, we have increased our research data sets by a factor of 4x, the markets we are tracking by 5x, and increased the number of deals we are able to underwrite by 4x. The ability to identify opportunities, test hypotheses, and scale is growing by the month. Success today, however, starts with an honest understanding of the relatively small and weak data sets currently available.
We see AI not as a replacement for judgment, but as a tool for processing the volume of data that separates signal from noise. The most reliable edge in 2026 is not finding the cheapest deal; it is having the tools, experience, and discipline to distinguish a discount from a trap.